
Chart of the Month | January 2025
Long-Term Perspective: Understanding How Valuations Impact Portfolio Returns
The S&P 500 has rallied +50% since the start of 2023 and more than +150% from the COVID
pandemic low in March 2020. The rally has produced a long list of all-time highs and boosted
investment portfolios, but it has made broad market indices more expensive. The S&P 500 currently
trades at over 21 times its next 12-month earnings estimate, a level not seen outside of periods like
the late-1990s tech boom and the recent post-COVID recovery, when interest rates were near
zero. Why do high valuations matter? History shows that while valuations have a limited impact on
short-term returns, they play a critical role in determining long-term performance.
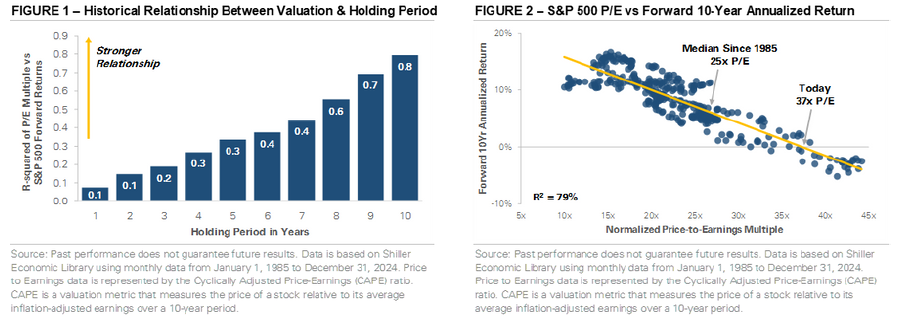
Figure 1 shows the relationship between the S&P 500’s starting valuation and future returns. The
horizontal axis represents holding periods in years, and the vertical axis shows the R-squared (R2)
between the S&P 500’s starting valuation and its forward return. R2 is a statistical measure that
shows the predictiveness between two variables. For example, an R2 of 0.40 indicates that 40% of
the changes in one variable can be attributed to changes in the other variable, while the
remaining 60% is due to other factors or random variation. The left side of the chart tracks short
holding periods of only a few years, revealing a low R2 between valuations and forward returns.
The takeaway is that the S&P 500’s starting valuation doesn’t explain a significant portion of its
short-term return. However, the R2 increases as you move across the chart, showing that valuation
explains a larger portion of longer-term returns. For a 10-year holding period, the S&P 500’s
starting valuation explains ~80% of the variability in returns, highlighting valuation’s importance for
long-term investors.
Figure 2 expands on the importance of valuations by plotting the S&P 500’s starting valuation
against its next 10-year annualized return. The starting valuation represents the S&P 500’s
normalized price-to-earnings (P/E) multiple, which is calculated as the current price divided by
the average inflation-adjusted earnings over the past ten years. The line slopes from the top left to
the bottom right, indicating that as the starting valuation increases, forward returns decrease. The
current normalized P/E ratio of 37 times is marked on the chart, suggesting the S&P 500 could
produce a low single-digit annualized return over the next ten years.
The previous statement carries significant weight, but it’s important to put context around
historical analysis like this. While past performance offers valuable insights, it doesn’t guarantee
future outcomes, and timing the market is difficult. Figure 1 shows that valuations aren’t reliable
indicators of short-term market returns, and markets can remain expensive longer than expected.
However, given the rarity of today’s starting valuation, it’s important to acknowledge the potential
impact on forward returns when setting expectations for the years ahead.
AdvisorDisclaimer: The material shown is for informational purposes only. Past performance is not indicative of future performance, and all investments are subject to the risk of loss. Forward-looking statements are subject to numerousassumptions, risks, and uncertainties, and actual results may differ materially from those anticipated in forward-looking statements. As a practical matter, no entity is able to accurately and consistently predict future marketactivities. While efforts are made to ensure information contained herein is accurate, Lokken Investment Group, LLC cannot guarantee the accuracy of all such information presented. Material contained in this publication should notbe construed as accounting, legal, or tax advice. This message is intended to be educational in nature and does not represent tax or legal advice. Lokken Investment Group, LLC is neither an accounting firm nor a law firm, and weencourage the reader to consult a tax or legal expert for specific tax or legal advice. The information provided is derived from sources deemed to be reliable, but we are unable to guarantee its reliability. For more information aboutLokken Investment Group, LLC and services provided, please contact us at jlokken@lokkeninvest.com or 302-645-6650